Studyplan user manual
Teacher view for study plans
While students can only see their own results in a studyplan, teachers that have the right to see studyplans in a certain context can see more
The teacherview shows teachers both statistics about the available grades as well as the results of individual students on request
Because the teacherview collects a lot of data to generate the statistics, it can take a while for the teacher view to load.
At the moment those statistics are not cached, but collected and calculated live on each request
Overview of study plans
If a user has the permission local/treestudyplan:viewuserrreport they can see the link Study plans in a category view they have the permission, or (if the primary navigation is properly configured) in the primary navigation bar.
Upon choosing the Study plans link the user is shown an overview of the studyplans availabel for viewing in the category selected.
(If no category is selected, the first available category where the user has the required permission will be shown.)
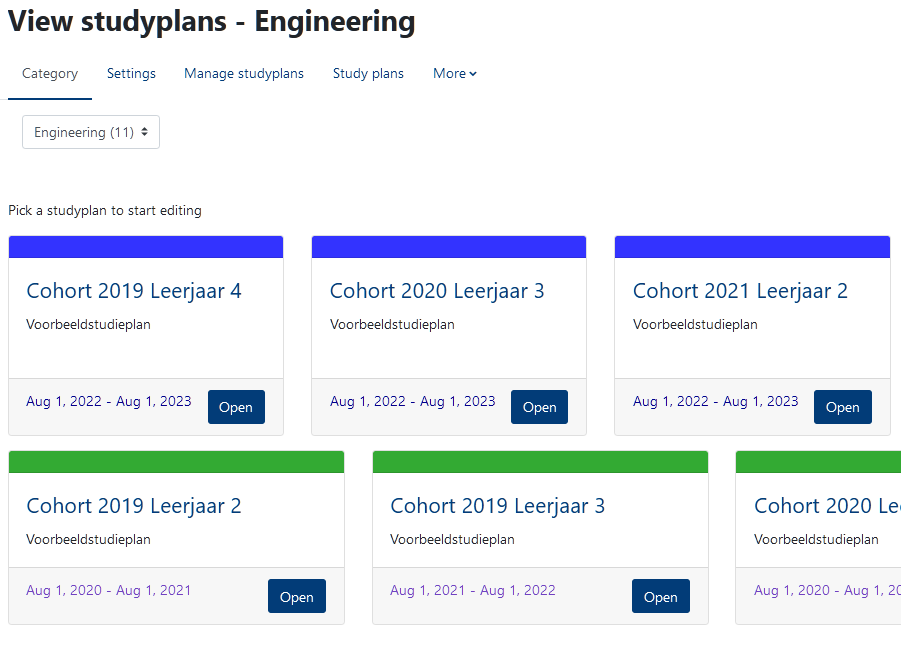
In the top left drop-down menu the user can choose any other category with studyplans that they have permission for.
The view shows info cards for each studyplans in relevant order: Current (blue), Past (purple) and Future (grey), with colored bars indicating the timing status
By clicking the info card's title or open button, the study plan is shown in detail (statistics view)
The colors can be tweaked by changing the CSS vars --past, --present and --future
These same colors are also used to indicate the timing status of courses in the studyplan view itself
Statistics view
The statistics view shows the studyplan in its entirety, but shows the completion statistics for each course or badge
![]()
The completion circle shows the total completion by filling up the circle, but also shows you the amount of:
- Passed criteria/activities
- Completed criteria
- Failed criteria/activities
- Ungraded activities
Badges will show a circle around them which fills up according to the number of students linked to the study plan who have achieved this badge
The colored tabs in front of each course show if the course is currently given (blue), in the past (purple) or in the future (grey)
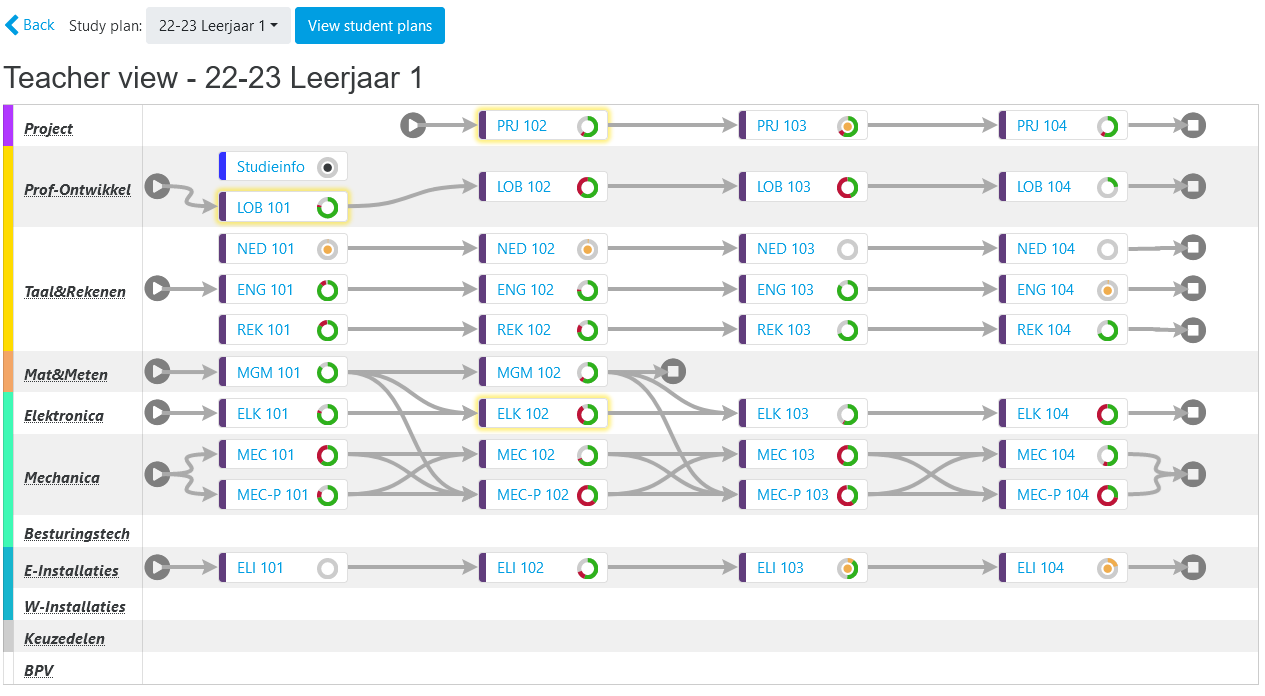
The courses that a teacher is personally teaching are given a yellow highlight around them.
This helps teachers find their own courses more easily
Course details
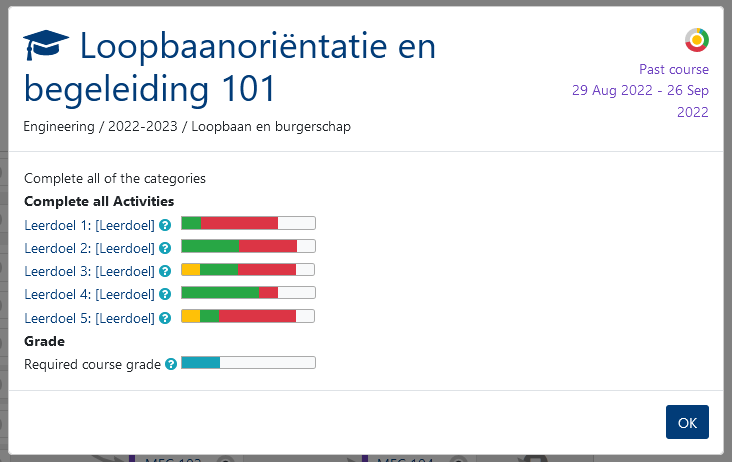
By clicking on the course title, the details view appears. Here all relevant criteria are shown
Each criterium has a progress bar that shows the student progress. For activities, this progress bar uses the same color scheme as the completion circle to show the completion statistics for that requirement.
By clicking on the icon, the specific requirements for the criterium are shown
Course details when using manual studyplan aggregation
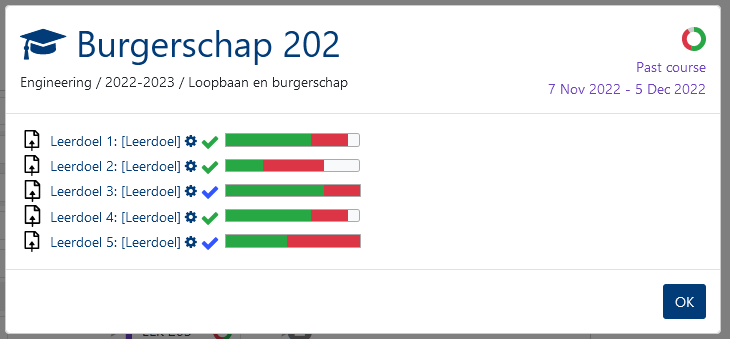
When using a manual aggregation method instead of the course completion method, the view is slightly different.
Here, only the gradable activities for this course are shown.
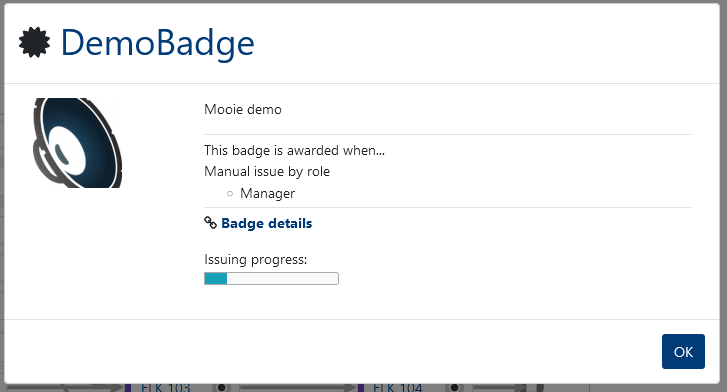
Badge details
By clicking on the badge, more information about it are shown, like description, award criteria and a link to the badge details
A progress bar is also shown, indicating how many students in the study plan have earned this badge
Allowing teachers to select gradables in manual mode
When using a manual aggregation method, if a teacher has the permission local/treestudyplan:selectowngradables a gear icon is shown This allows the teacher to select which gradable activities are shown in the studyplan.
Viewing student studyplans
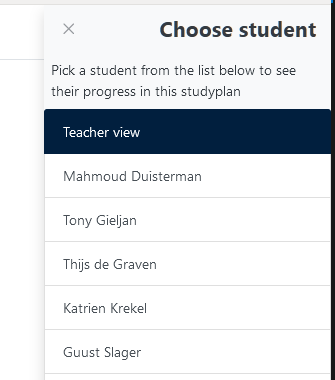
To view the results of individual students, the teacher can click on the button
This opens a drawer to the right of the screen, where the teacher can select any of the students linked to this study plan and view their results
This view is identical to the view that the students themselves see when viewing their study plan.
By selecting , the teacher can return to the teacher view